Posts

Showing posts from November, 2018

Dynamic data display Based on User Selection

Image
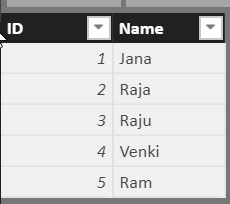
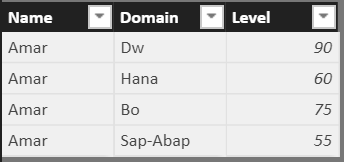
Description:  Sometimes we need to display the dynamic data based on Slicer Selection in Power-BI. Let me describe the scenario and the steps to achieve it. Step 1:    Source Data Step 2:   Create one calculated measure:   Step 3: Drag slicer from visualizations panel to Designer part. Step 4:  Drag ID column to slicer field so that the slicer will get impacted by ID column data. Step 5: Drag card visual from Visualization panel to Designer part.             Step 6:  D rag measure to the card visual field, then slicer will be impacted by Measure column. Step 7: Now go ahead and check the card visual, it will be work as per our requirement. Follow the below picture for easy recognition. Step 8: If you don’t select any slicer value then card visual will be shown as “ALL SELECTED” Thank you.

Changing the X and Y axis values based on Slicer Selections in Power-BI

Image
Description:         This blog consists of the dynamic change of X and Y chart values based on Slicer data Selection. Step 1: Source: Excel File Sheets Sheet 1: Sheet 2:    Sheet 3:     Sheet 4:           Sheet 5: Step: 2      As per our requirement, we need to create one calculate table and insert data based on variable values. Now go to modelling option and Click on New Table then Table will appear on Design Part .     Step 3:    Now we can create variables and assign particular source data as variable values. Step 4:     Table structure and data created based on the above variable values. Step 5:    Now we need to write one calculated measure in a calculated table for dynamic X&Y chart changes. Used DAX functions: 1. If   2. Hasonevalue   3. Switch   4. Calculate    5. Sum    6. Treatas Measure:     Measure = if(HASONEVALUE('Table'[Name]),               

How to show Rating Stars and Traffic Light Indicators in Power-BI

Image
Description:  In most of the scenarios we need to visualize the Data (Performances) with Rating Stars or Traffic light indicators.                     Following are the steps illustrating the performance indicators in Power-BI reports. Source:       Step 1:         As per the data our requirement, the stars in a new column based on the rating column. So we need to write a measure with Unichar codes. Please follow the below measure for stars rating. Measure:  Stars = REPT(UNICHAR(9733), AVERAGE('Sheet1'[Rating ]))      & REPT(UNICHAR(9734), 5-AVERAGE('Sheet1'[Rating ]))  Output:     Step 2:        Now we can write two more measure with unichar codes based on the same rating column. Measure 1:      Mensymbol = REPT (UNICHAR (128697), AVERAGE ('Sheet1'[Rating])) Output: Measure 2: Lights = REPT(UNICHAR(11044), AVERAGE('Sheet1'[Rating ])) Output: