How to show Rating Stars and Traffic Light Indicators in Power-BI
Description: In most of the scenarios we need to visualize the Data (Performances) with Rating Stars or Traffic light indicators.
Following are the steps illustrating the performance indicators in Power-BI reports.
Following are the steps illustrating the performance indicators in Power-BI reports.
Source:

Step 1:
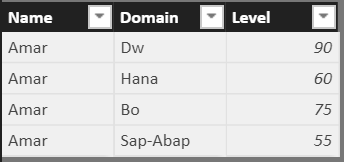
As per the data our requirement, the stars in a new column based on the rating column. So we need to write a measure with Unichar codes. Please follow the below measure for stars rating.
Measure:
Stars =
REPT(UNICHAR(9733), AVERAGE('Sheet1'[Rating ])) &
REPT(UNICHAR(9734), 5-AVERAGE('Sheet1'[Rating ]))
Output:

Step 2:
Now we can write two more measure with unichar codes based on the same rating column.
Measure 1:
Mensymbol =
REPT (UNICHAR (128697), AVERAGE ('Sheet1'[Rating]))
Output:

Measure 2:

Lights =
REPT(UNICHAR(11044), AVERAGE('Sheet1'[Rating ]))
Output:

Note: Use conditional formatting on lights measure for requiring colour conditions.
Thank you.
Comments
Post a Comment