Dynamic data display Based on User Selection
Description: Sometimes we need to display the dynamic data based on Slicer Selection in Power-BI. Let me describe the scenario and the steps to achieve it.
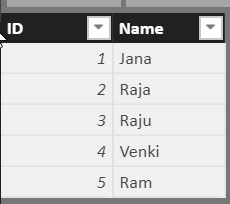
Step 1: Source Data
Step 2: Create one calculated measure:
Step 3: Drag slicer from visualizations panel to Designer part.
Step 4: Drag ID column to slicer field so that the slicer will get impacted by ID column data.
Step 5: Drag card visual from Visualization panel to Designer part.
Step 6: Drag measure to the card visual field, then slicer will be impacted by Measure column.
Step 7: Now go ahead and check the card visual, it will be work as per our requirement. Follow the below picture for easy recognition.
Step 8: If you don’t select any slicer value then card visual will be shown as “ALL SELECTED”
Thank you.


Comments
Post a Comment